Recent Trends in Housing Costs in the Southwest Region
- November 4, 2022
- Housing, RHNA
This Fall, SWRPC has continued its work on the Regional Housing Needs Assessment (RHNA) which will comprehensively assess the region’s housing needs and challenges. In Southwest NH, housing supply and affordability continues to be a significant concern as was expressed by many in our region the our public survey completed earlier this year.
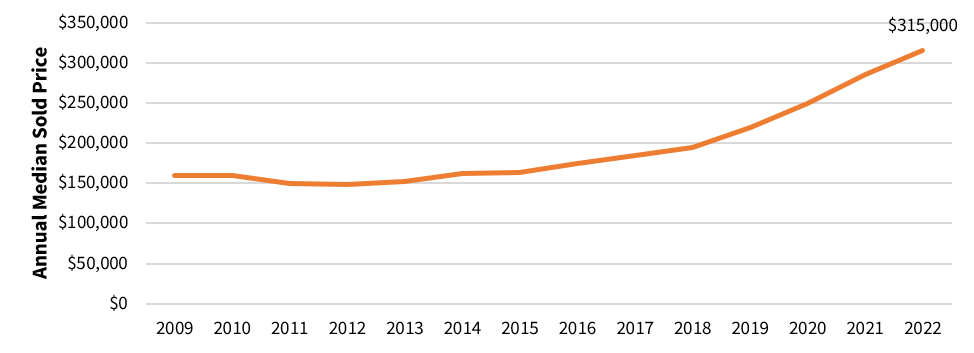
In analyzing recent data, we can see the significant changes in the region’s housing market in recent years. According to Multiple Listing Service (MLS) sales data, the annual median home sale price in the Southwest Region reached its highest point in 2022 at $315,000.
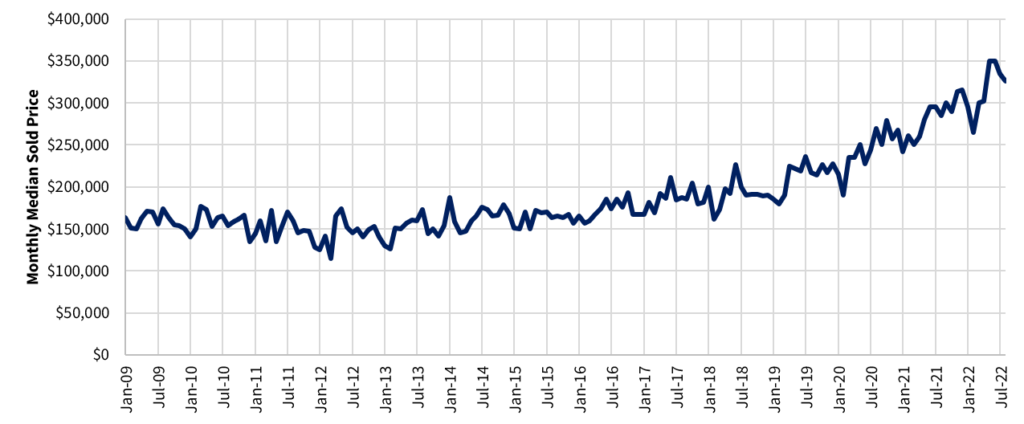
Looking at this data by month, this most recent summer saw the highest median home prices ever recorded in Southwest NH, reaching their peak in May and June at $350,000. This represents a 58% increase when compared to just three years prior in May 2019 ($221,750).
Beginning in 1980, New Hampshire Housing has collected statewide data on rental housing costs in order to help inform the general public, businesses, and organizations that are on the front lines of housing issues and programs throughout the state. The most recent 2022 survey was conducted through the University of New Hampshire Survey Center between March and May 2022 as well as through additional outreach to property owners and property managers.
Gross rents are calculated for each property in the survey by adding the rent charged by the landlord with a dollar allowance for those utilities paid by the tenant. By using these allowances, it assists the data researchers by effectively standardizing rental costs. The utility allowances are determined at the time of the survey and are based on physical consumption allowances determined by HUD and data made available from state electric, oil and propane suppliers each year.
Median gross rents are presented by geographic areas and for various unit sizes.
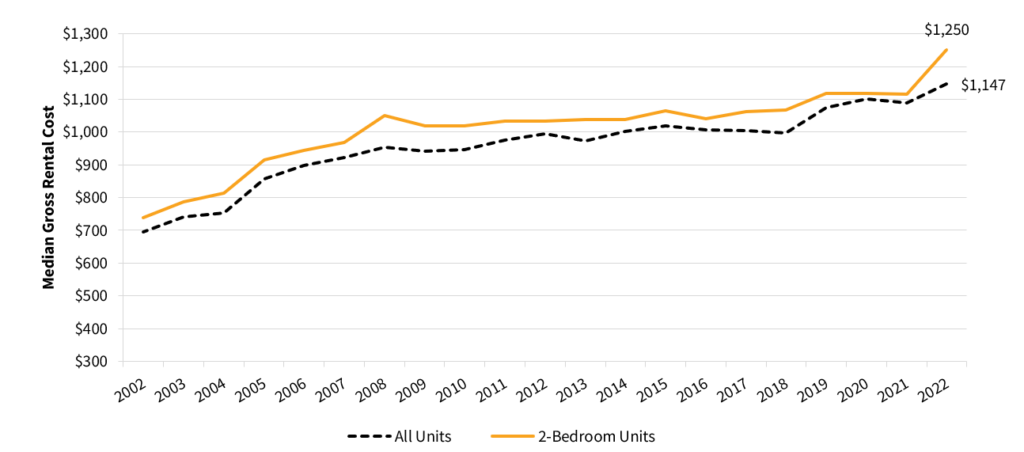
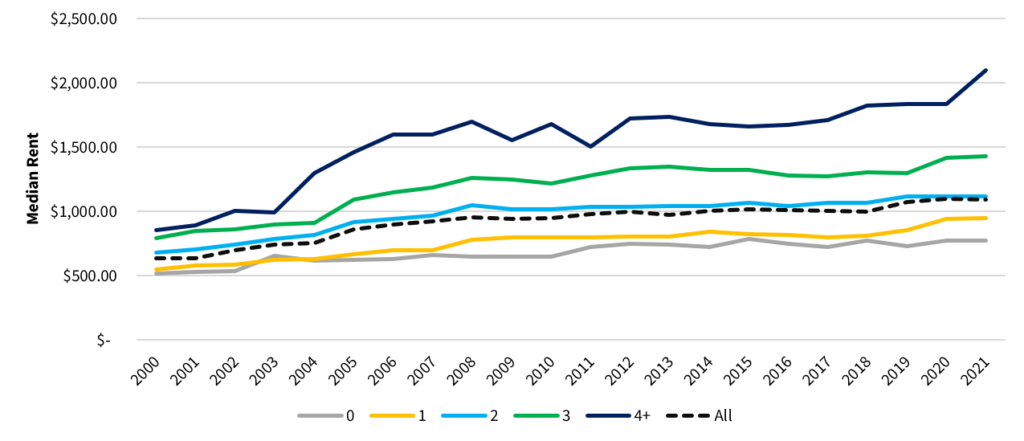
As of 2022, the median gross rent for all units in Southwest NH was $1,147, up more than 14% in the past 5 years (compared to +32% statewide). Median gross rent for a 2-bedroom unit increased more than 17% over the same time period (compared to +26% statewide), reaching $1,250/month in 2022.
Gross rents for larger units (i.e., 3-bedrooms or more) have also trended upwards over the same time period (see figure below). In particular, housing units with 4+ bedrooms increased by the greatest percentage between 2020 and 2021 (14%) to a median gross rent of $2,096 per month.
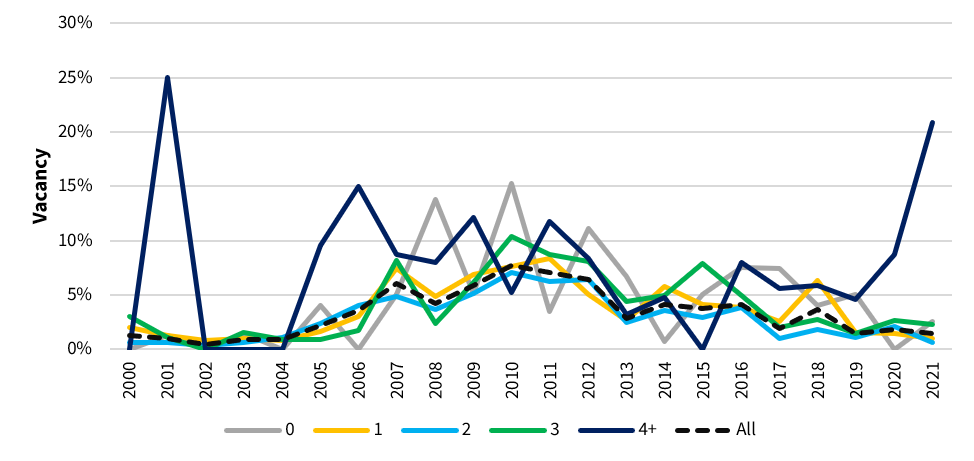
Southwest NH’s rental vacancy rate was 1.4% in 2021 for all units, and lowest among 2-bedroom units (0.6%) and 1-bedroom units (1%). A balanced rental market has a vacancy rate of around 5%, where supply of available rental units is better matched with demand. The last time the Southwest Region had a vacancy rate of 5% was 10 years ago in 2012.
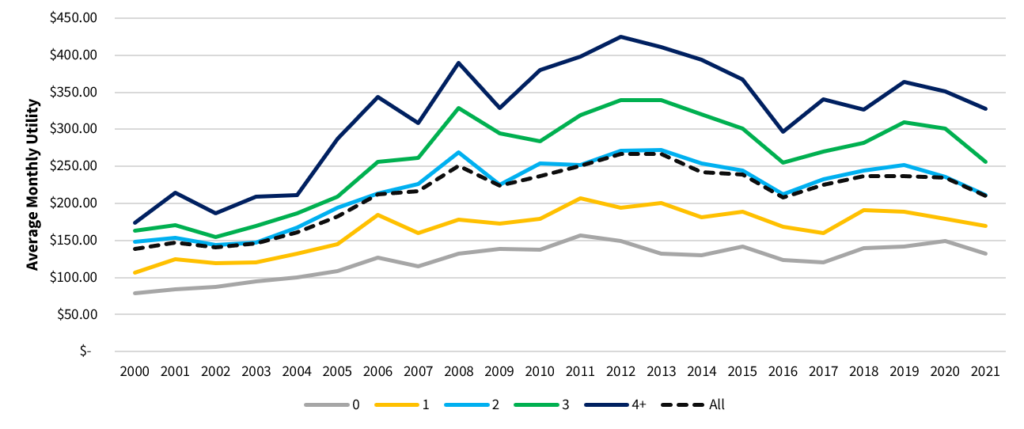
As mentioned above, NH Housing applies utility allowances to contracted rents when the tenant is responsible for paying utility costs. These allowances are determined from data gathered from state electric, oil, and propane suppliers yearly in December and January. In the Southwest Region, average utilities peaked to their highest in 2012 and 2013 at $266 average annual utilities for all units. In 2021, the average utilities were $209.98 for all units. When analyzing by unit size, the average annual utility bills were as follows: $132.18 (0-bedroom), $169.71 (1-bedroom), $211.54 (2-bedroom), $256.00 (3-bedroom), and $327.47 (4+ bedroom). These figures exceeded the state average for all unit sizes in 2021.
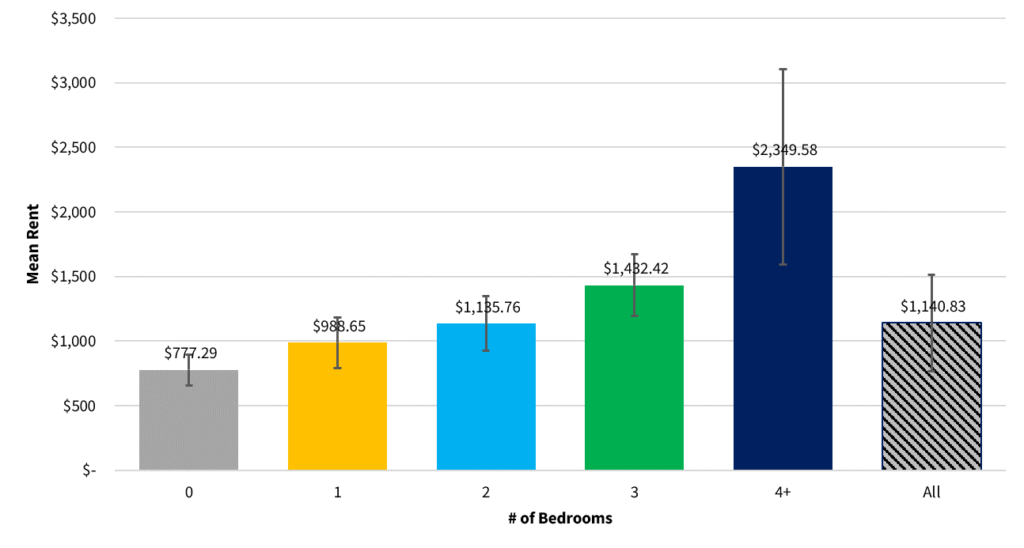
While less commonly used than the median figures – due to the increased influence by extremes in costs – the mean and standard deviation rents by unit size are presented in the figure below. The mean rent in the Southwest Region for all units was $1,140.83. The minimum rent identified in the survey was $500/month (for a 1-bedroom unit) and the maximum was $3,845/month for a unit that was four bedrooms or greater. The standard deviation bars indicate how dispersed or wide-ranging the full array of surveyed rents were for each unit size. The smaller the standard deviation, the more clustered the rents were (for 0-bedroom units, for example), while the larger units tended to vary more in terms of their rent in relation to the average.
Stay tuned for more updates and insights at www.swrpc.org/housing as SWRPC continues working on the RHNA over the next several months. For more information, please contact Sean O’Donnell of SWRPC staff.


